Data Visualisation with Ruby - Chris Lowis
There aren't many native data visualisation tools for Ruby. Chris has had a good look round to see what the options are for visualising data in Ruby, and he's put quite a few examples on github.
Scruffy is pretty much the best native Ruby plotting library. It generates SVG graphs, and does basic functional plotting. There hasn't been much recent activity, and it doesn't let you do much data analysis. So what are the alternatives?
Google Charts
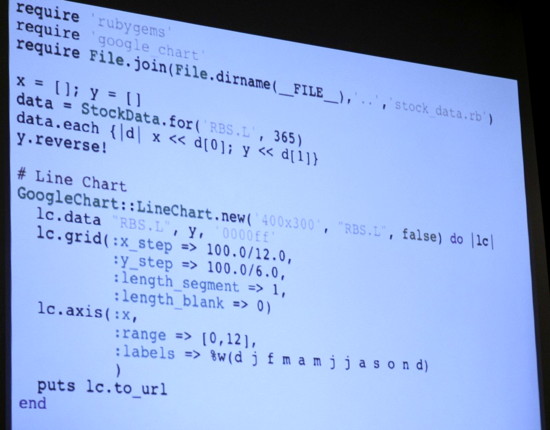
The Google charts API allows you to submit data to Google, and their API will respond with a URL to an image. You can do venn diagrams, scatter graphs, polar charts, bar charts, world maps, etc. It's a nice way to embed some graphs in a web app.
Here's a code sample:
A couple of JavaScript plotting libraries got a mention during the questions and answers session that would make good alternatives for plotting on the web:
Timetric
Another web based service, Timetric is a data analysis web service. It's free to use, and you can upload your data through the site or the API. You can also compare your data with publicly available data sets (e.g. the price of corn in the 1920s). You can also do some basic data fitting.
Chris has released his slides (pdf), and you'll find example source code in there.
Tioga
The back end of Tioga is LaTeX, so you do need to have it LaTeX available on your computer before you can use it. It does, however, produce some beautiful PDF output.
JFreeChart
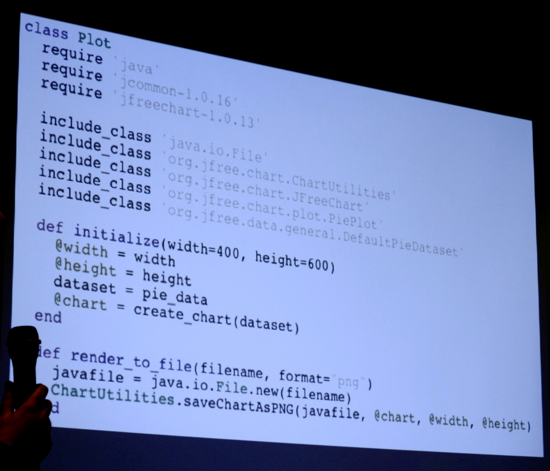
JFreeChart is an enterprise style Java plotting library, which you can use from jRuby. Chris did the simplest thing you can possibly do, and it was still two pages of code. I got the impression that he isn't Java's biggest fan.
You do, however, get a lot of control with JFreeChart over the output of your chart. It seems pretty capable, and worth a look if you're into your jRuby. Here's a screenshot of (some) of the code:
GnuPlot
It's a mature project, and can do some data analysis in addition to just plotting data. It's under active development, and (as of recently) can produce HTML5 Canvas output. There are a couple of Ruby bindings for GnuPlot, but it's easier to use the native GnuPlot commands via IO.popen.
def gnuplot(commands)
  IO.popen("gnuplot", "w") { |io| io.puts commands }
end

commands = %Q(
  set terminal svg
  set output "curves.svg"
  plot [-10:10] sin(x), atan(x), cos(atan(x))
)
gnuplot(commands)
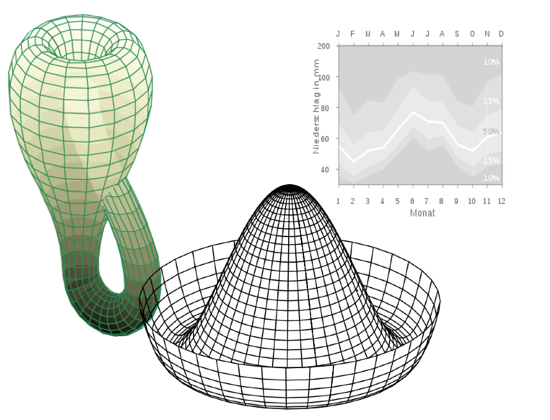
The output is also rather attractive. We didn't get any photos of the graphics, but I've purloined this from Chris's slides (you'll find the PDF in his github account):
R
R is a statistical programming language, and therefore does a lot more than plotting. You can do linear algebra, modelling, financial calculations, classical statistical tests, etc. You can control R directly from Ruby with the RSRuby library:
require 'rsruby'

cmd = %Q
(
  pdf(file = "r_directly.pdf"))
  boxplot(c(1,2,3,4),c(5,6,7,8))
  dev.off()
)
I've played with R and consider it to be "hot shit".
Summary
It was a great overview of the available options, with some good example graphics (unfortunately we didn't get any pics of those). Chris clearly put a lot of time into researching all these options, and he's saved us a lot of time in the process.
You can find Chris on Twitter at @chrislowis. He's also put a lot of example code on github.
More talks from Ruby Manor
- Browser Level Testing - Martin Kleppmann
- Denormalising Your Rails Application - Dan Lucraft
- gem that - James Adam
- Introduction to Rango - Jakub Šťastný
- Ruby and Cocoa - James Mead
- RubyGoLightly - Eleanor McHugh
- Secrets of the Standard Library - Paul Battley
- Short Order Ruby - Ben Griffiths
- Testing Third Party HTTP APIs - Richard Livsey and Bartosz Blimke
- The Joy of Painting with Ruby - Jason Cale
- Ruby Manor 2008 morning session and afternoon session