Debugging JavaScript in WebKit
If you do much web development you're probably a big fan of the Firebug plugin for Firefox. It really is a rare gem in the web developer's arsenal. When I'm not developing I prefer to use Safari -- it seems faster and leaner, so I often find that I've got both browsers open at once.
A couple of days ago something rather fantastic happened -- Safari got a makeover.
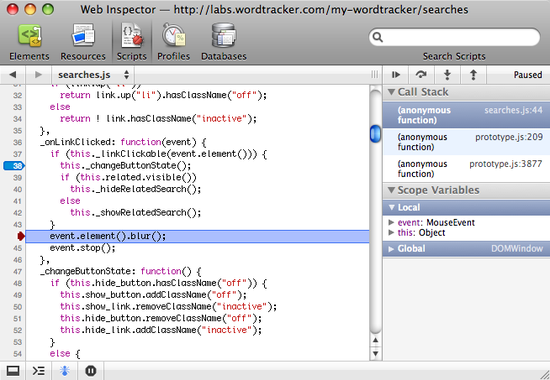
More specifically, the WebKit Web Inspector got a makeover, and now seems to be a viable competitor to Firebug. Here's a quick screenshot of the debugger in action:

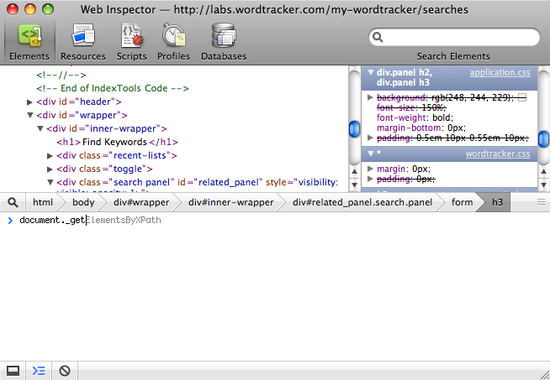
I'm also a big fan of the JavaScript code completion in the console. Here's an example, with the code completion reminding me of the name of Prototype's _getElementsByXPath() function (which I rarely manage to type correctly in Firebug, but find very useful for debugging my XPath statements):

You can see from the position of the cursor that I've typed document._get, and that Web Inspector is suggesting "ElementsByXPath". Pressing tab cycles between matching names, and the right cursor key completes the function, moving the cursor to the end of the line. It's the little things…
You can open the console at any time by pressing Esc (or clicking the second icon from the left at the bottom of the Web Inspector window).
There are loads more features. Check out the WebKit blog post that covers the redesign, or get yourself over to the WebKit nightly build page and download a copy (it doesn't affect your existing installation of Safari, but can function as a drop in replacement, so there's no risk and you can flip between them at will).